Advanced Analytics customers have a suite of additional tools at their disposal, offering a detailed exploration of Synergy's stats. These features help highlight hidden strengths, inconsistencies, and efficiency metrics that can be critical for shaping in-game strategies:
- Advanced Filters
- Lineups
- Game Log Table
- Multi-Game shot chart
- Scouting Report
Advanced Filters
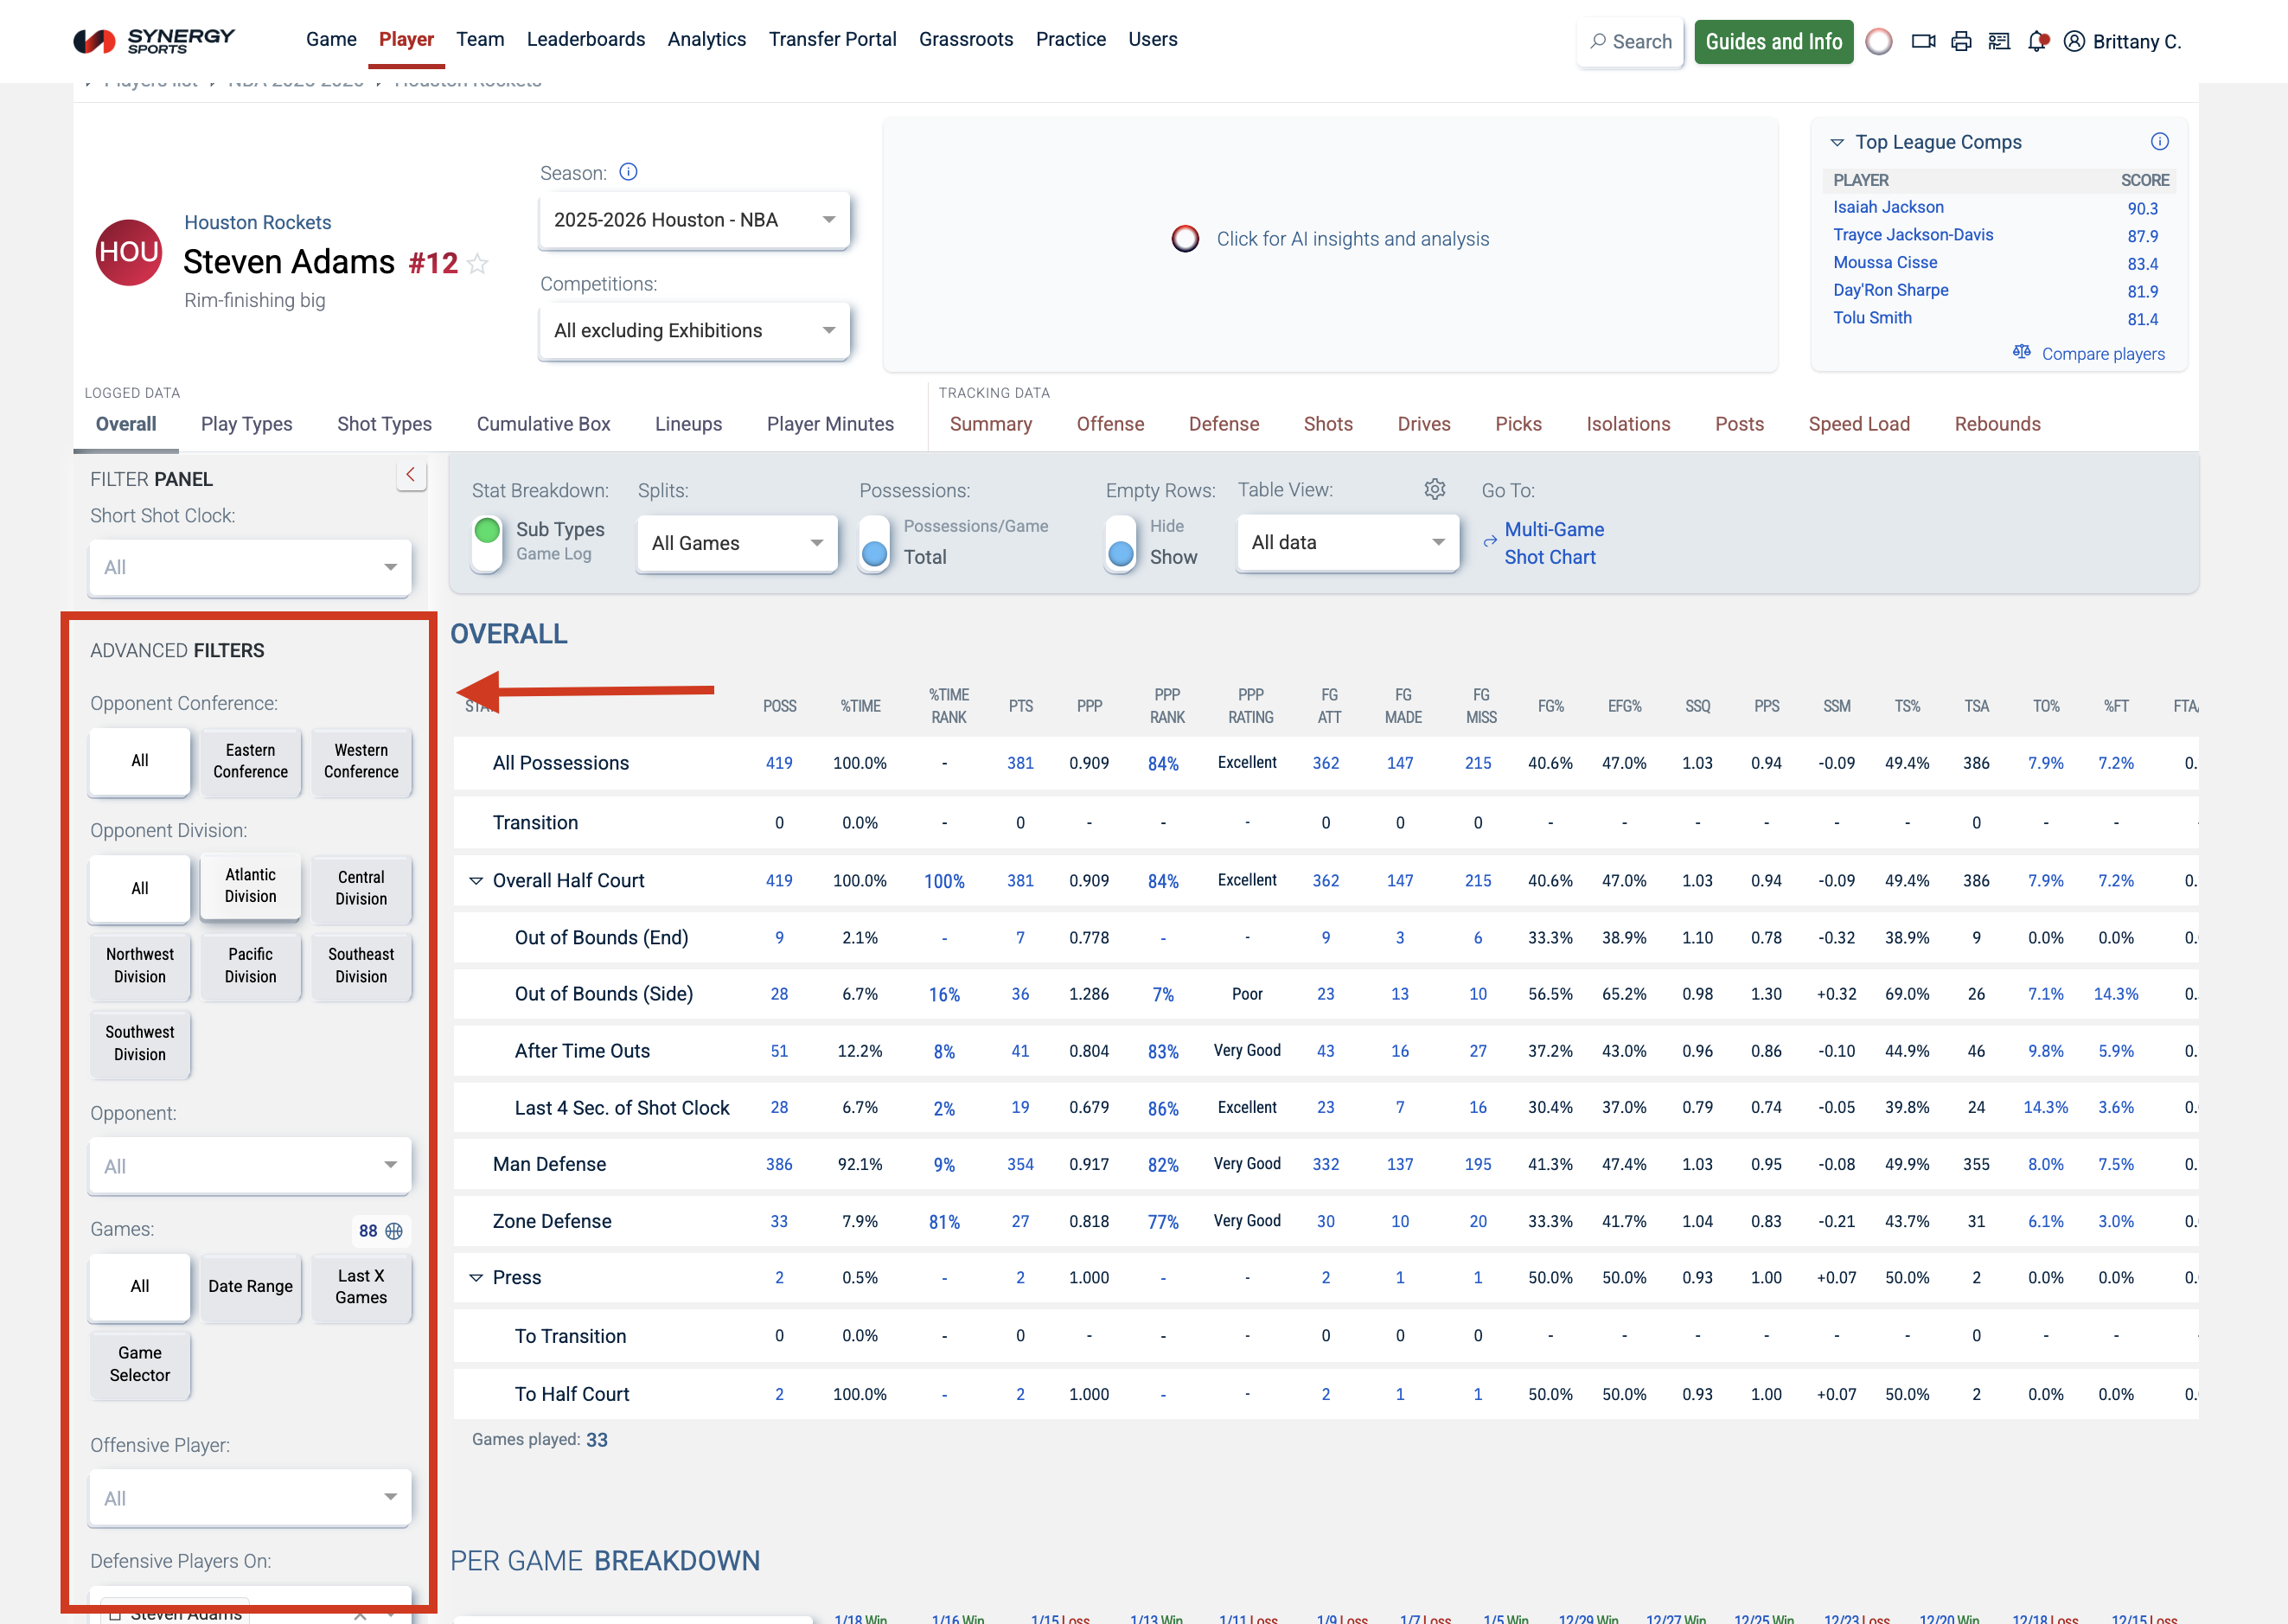
On the player pages and team pages, users can access a host of Advanced Filters. These filters span the Overall, Play Types, Shot Types, Lineups, and Game Log tabs:
| *Opponent Conference | *Offensive Players On | *Drive Direction | *Shot Quality |
| *Opponent Division | *Offensive Players Off | *Derived Offense | *Shot Distance |
| *Opponent | *Defensive Players On | *Derived From Play Type | *Shot Types |
| *Games Filters | *Defensive Players On | *After Pass Play Type | *Clutch Time |
| *Primary Defender | *Possessions Result | *Ball Handler | *Periods |
| *Offensive Player | *Play Types | *Out of Bound Situations | *Point Spread |
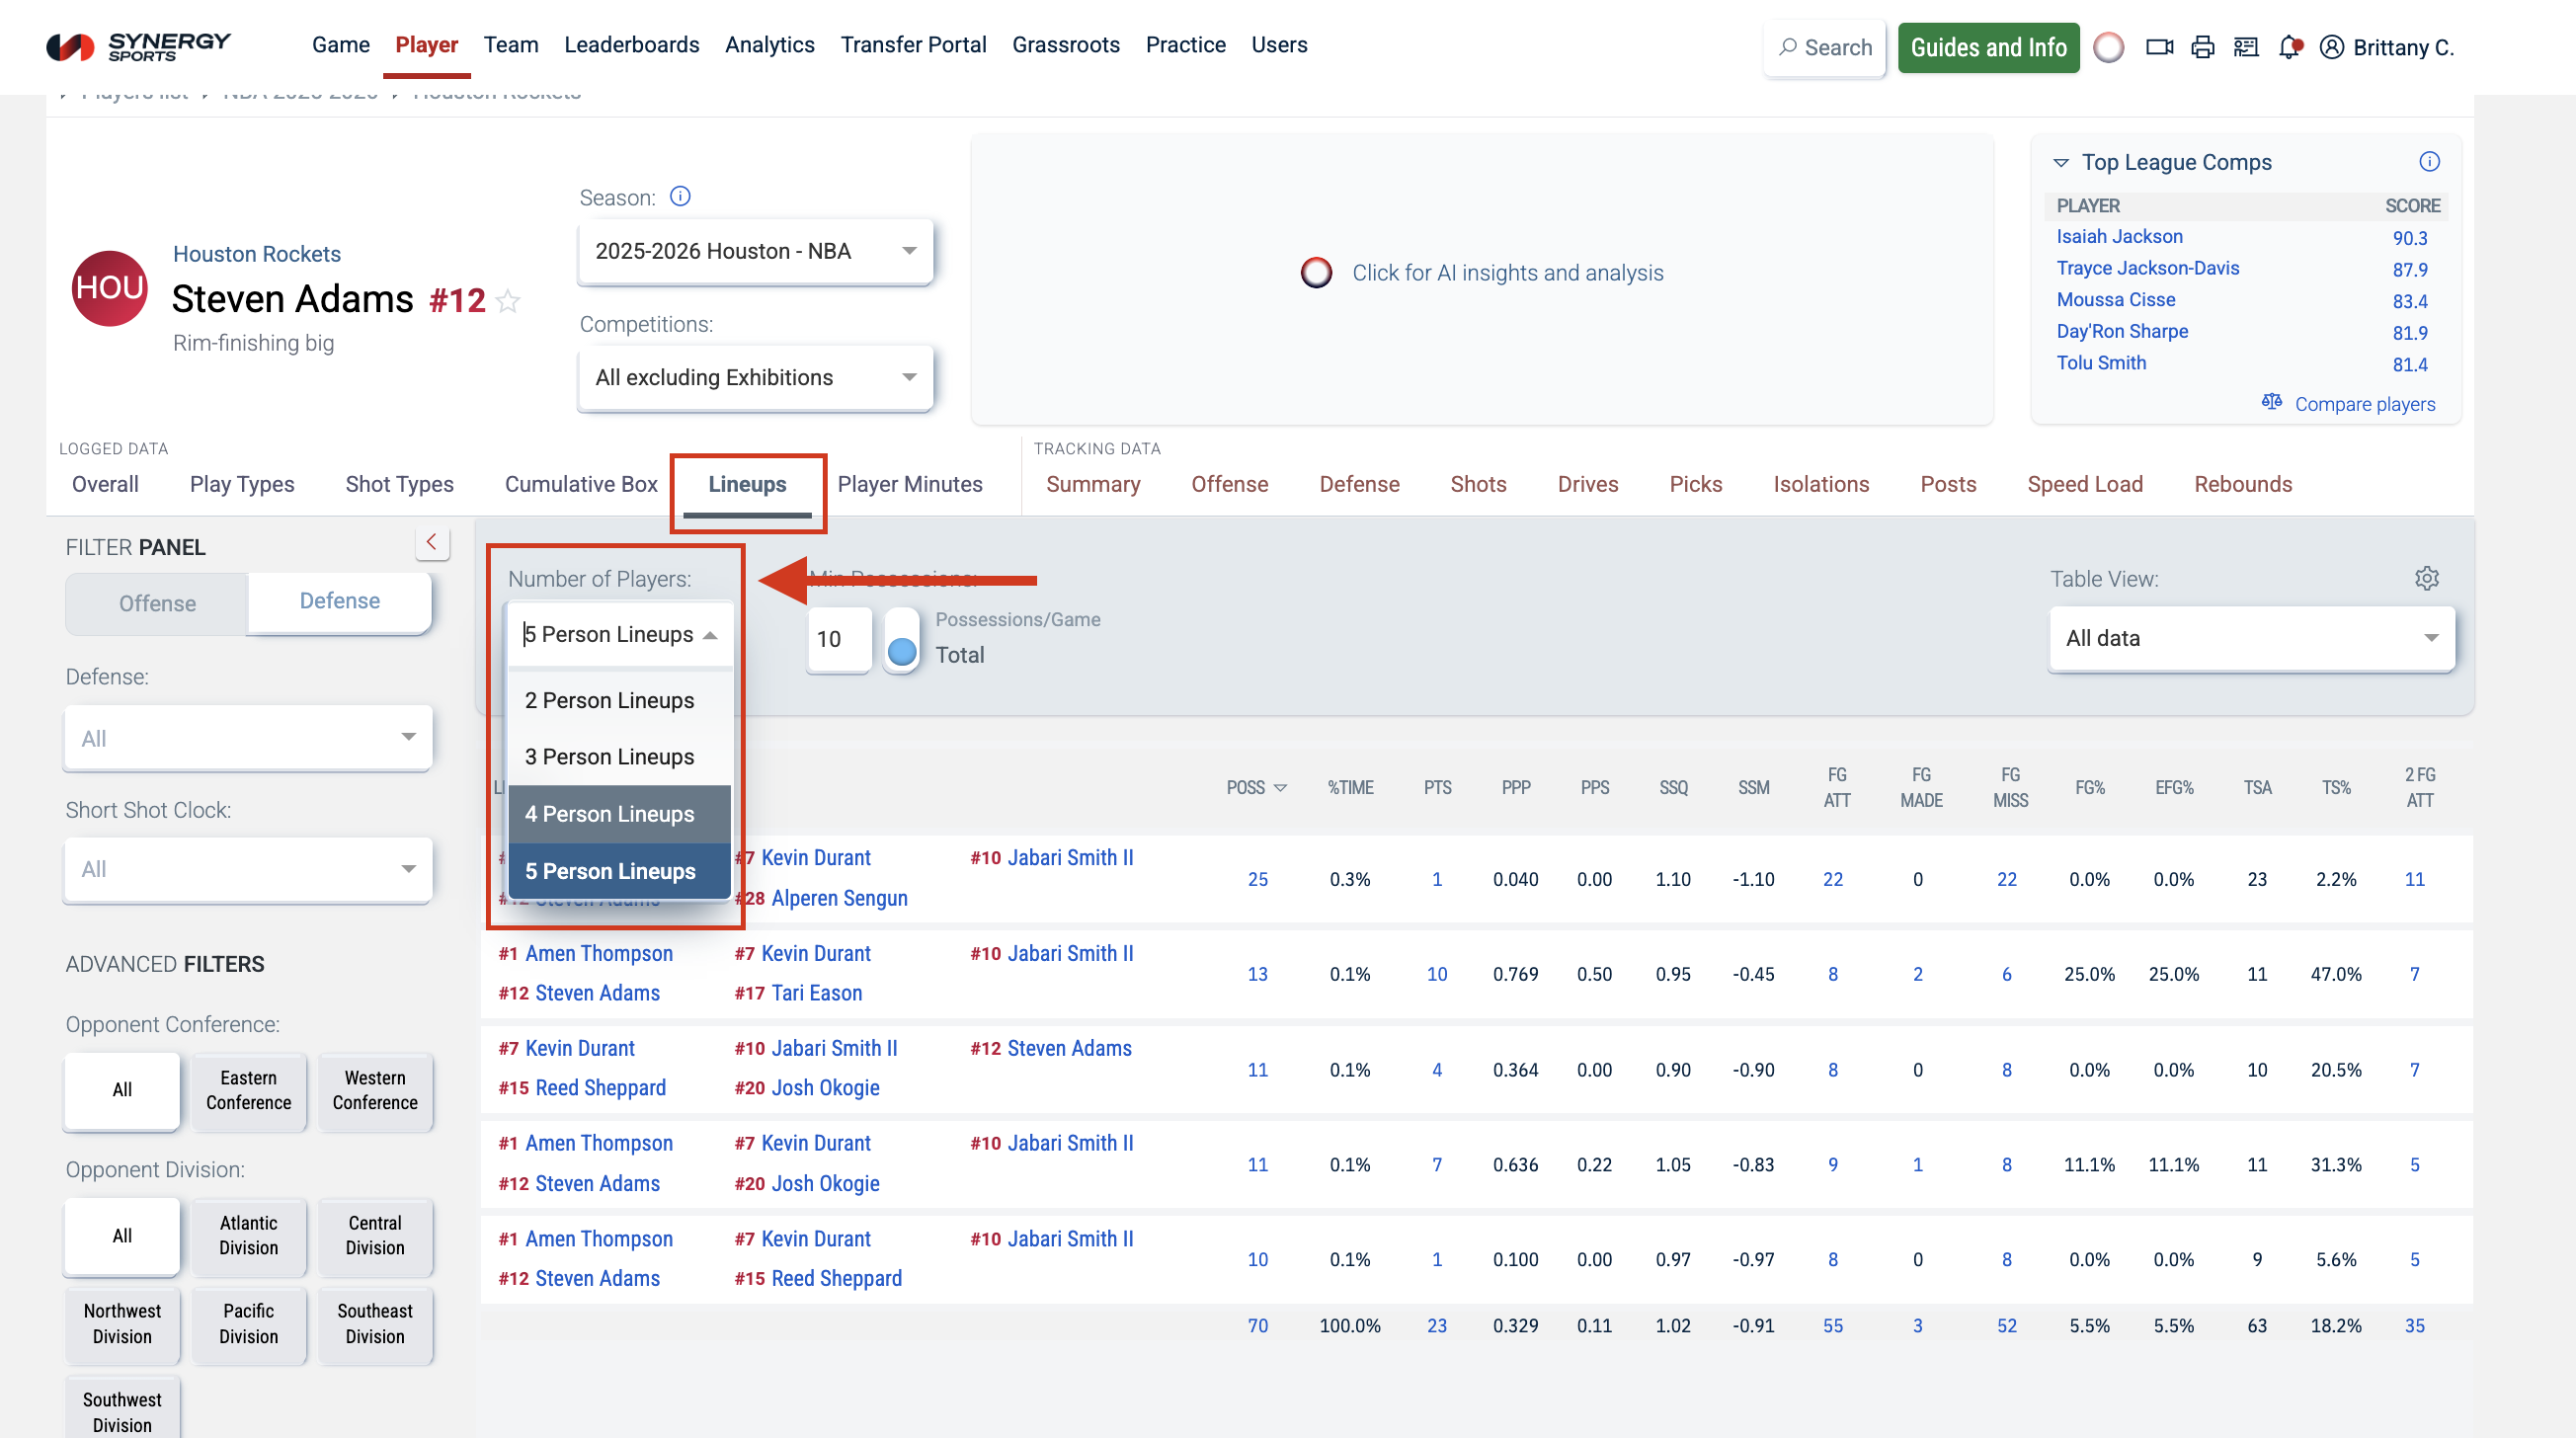
Lineups
The Lineups tab is available on the player and team pages to let you track how players perform together. You can elect 2, 3, 4, or 5-person lineups to reveal hidden chemistry and expose player combinations that boost or hurt team efficiency.
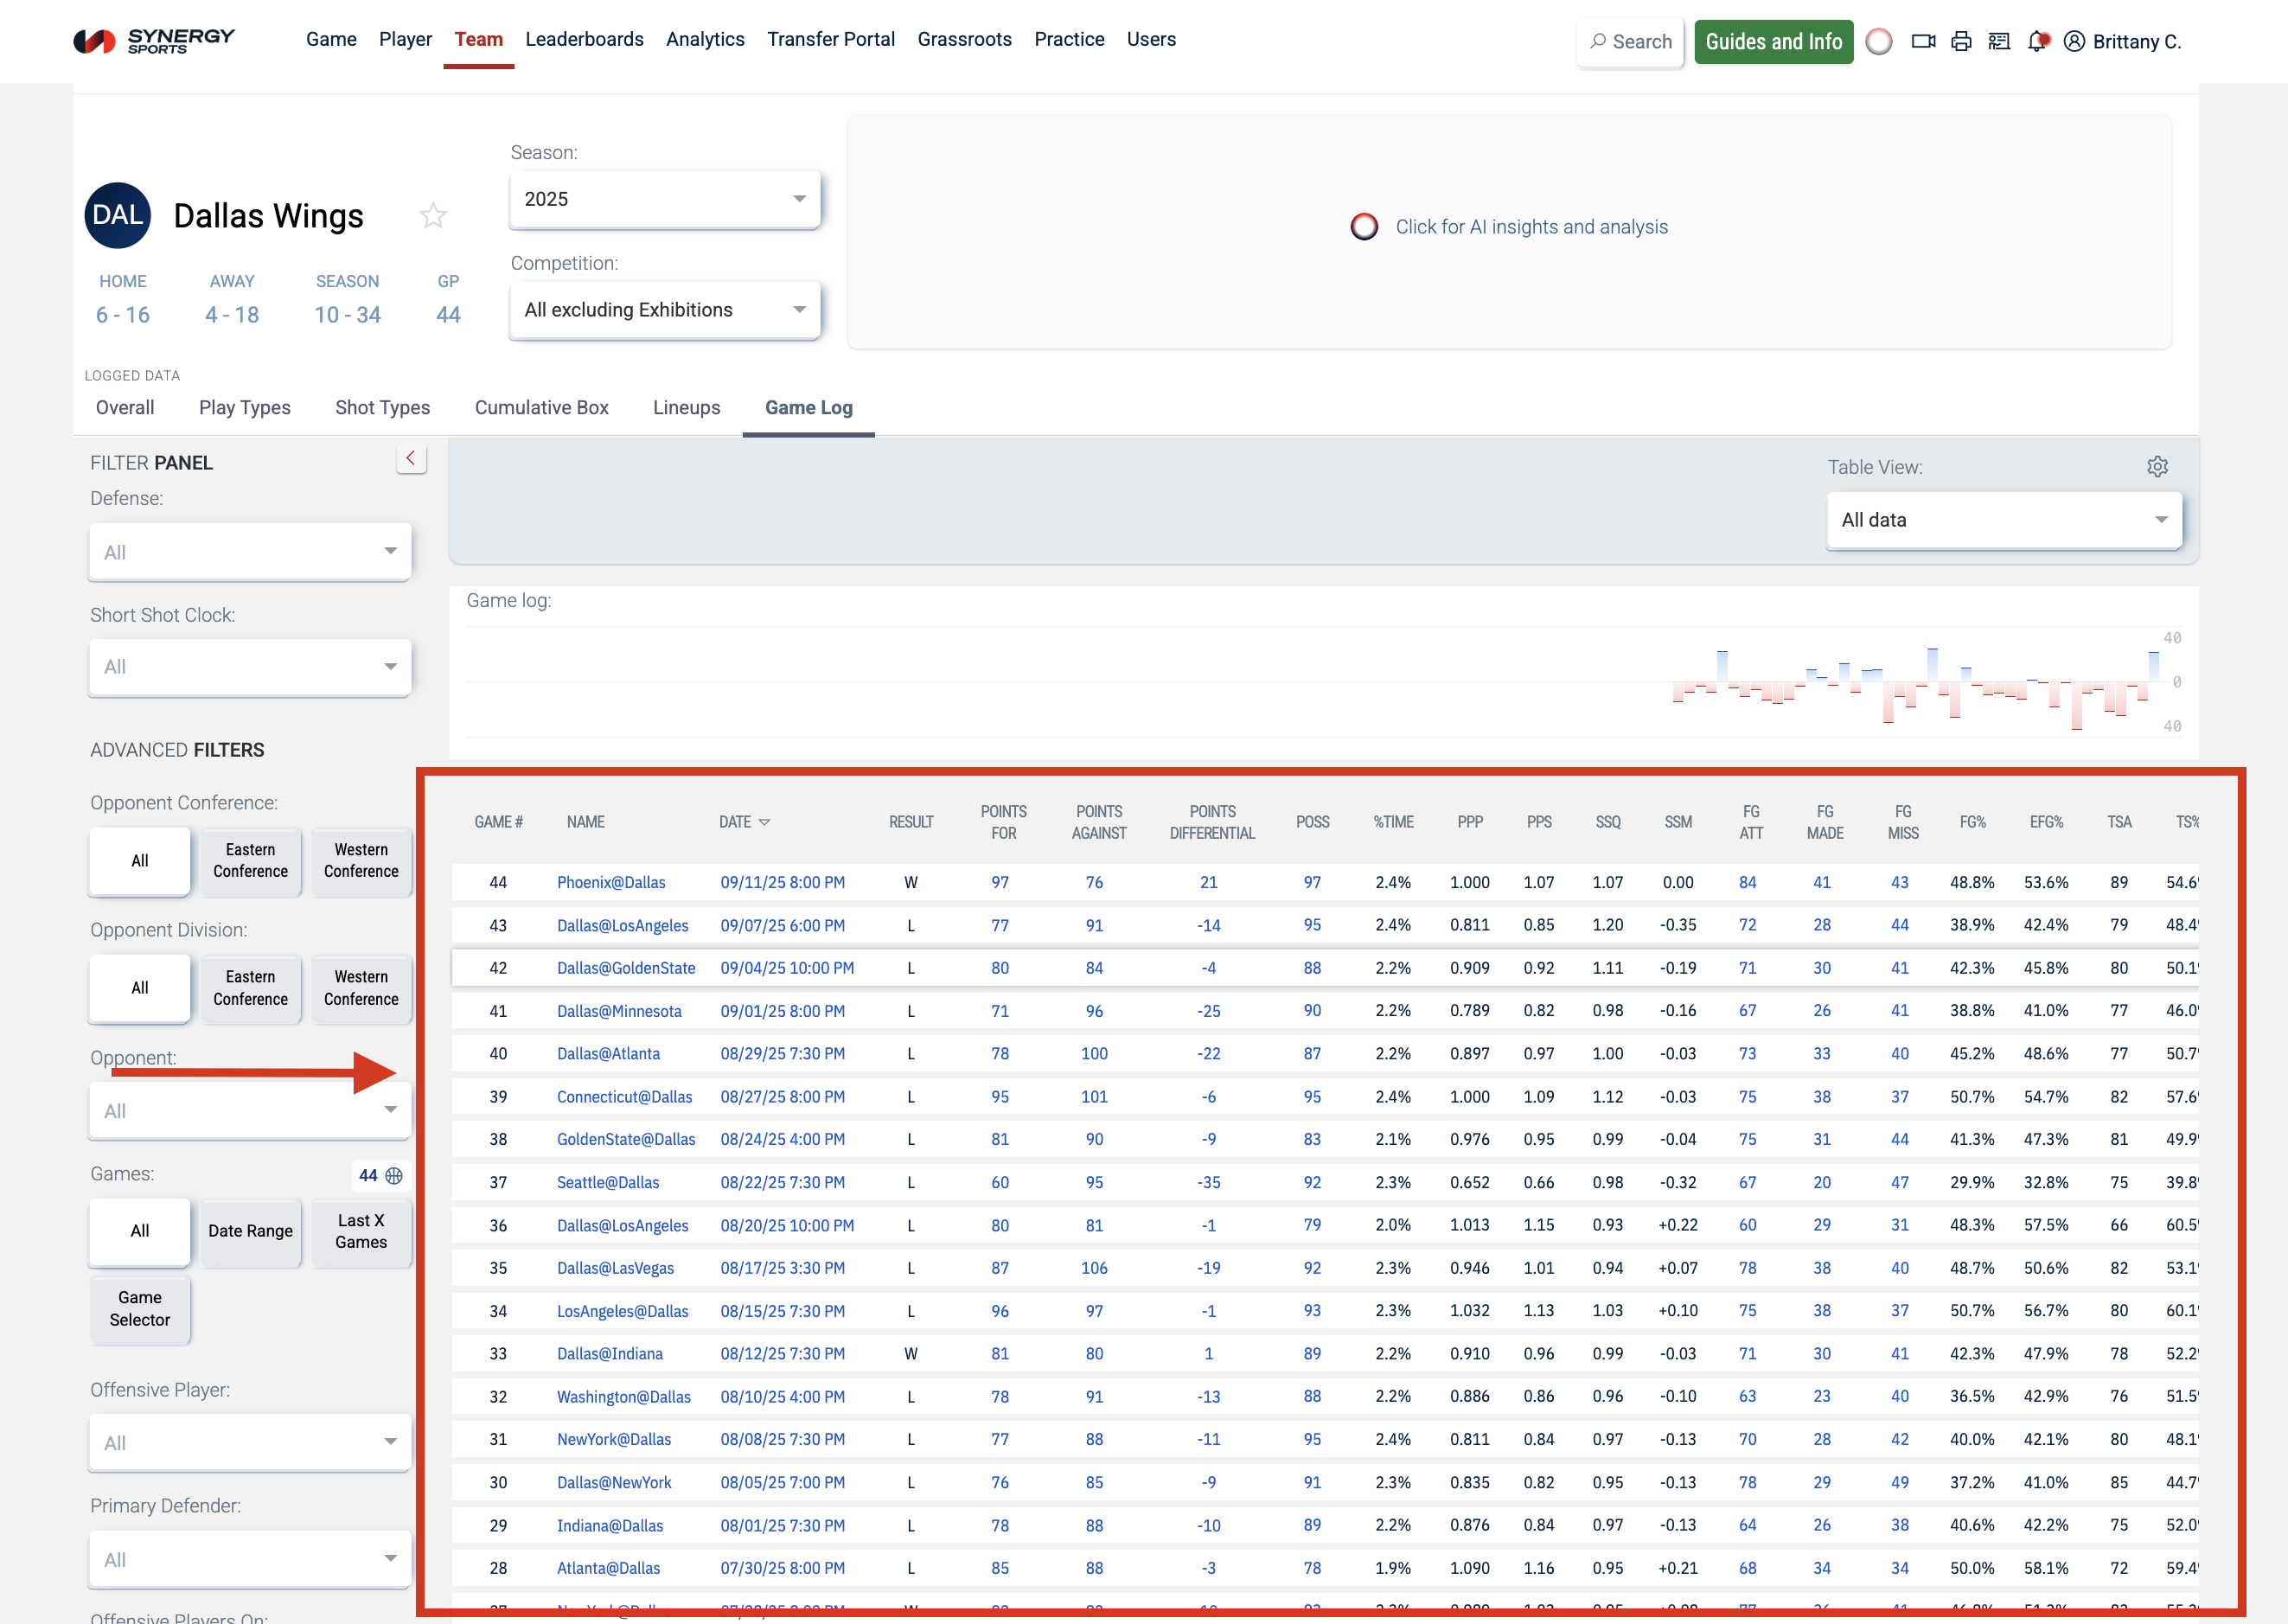
Game Log Table
In addition to the Game Flowchart, Advanced Analytics users can get additional insights from the Game Log table. This table makes it easier to track trends, consistency, fatigue patterns, and matchup advantages over the course of a season.
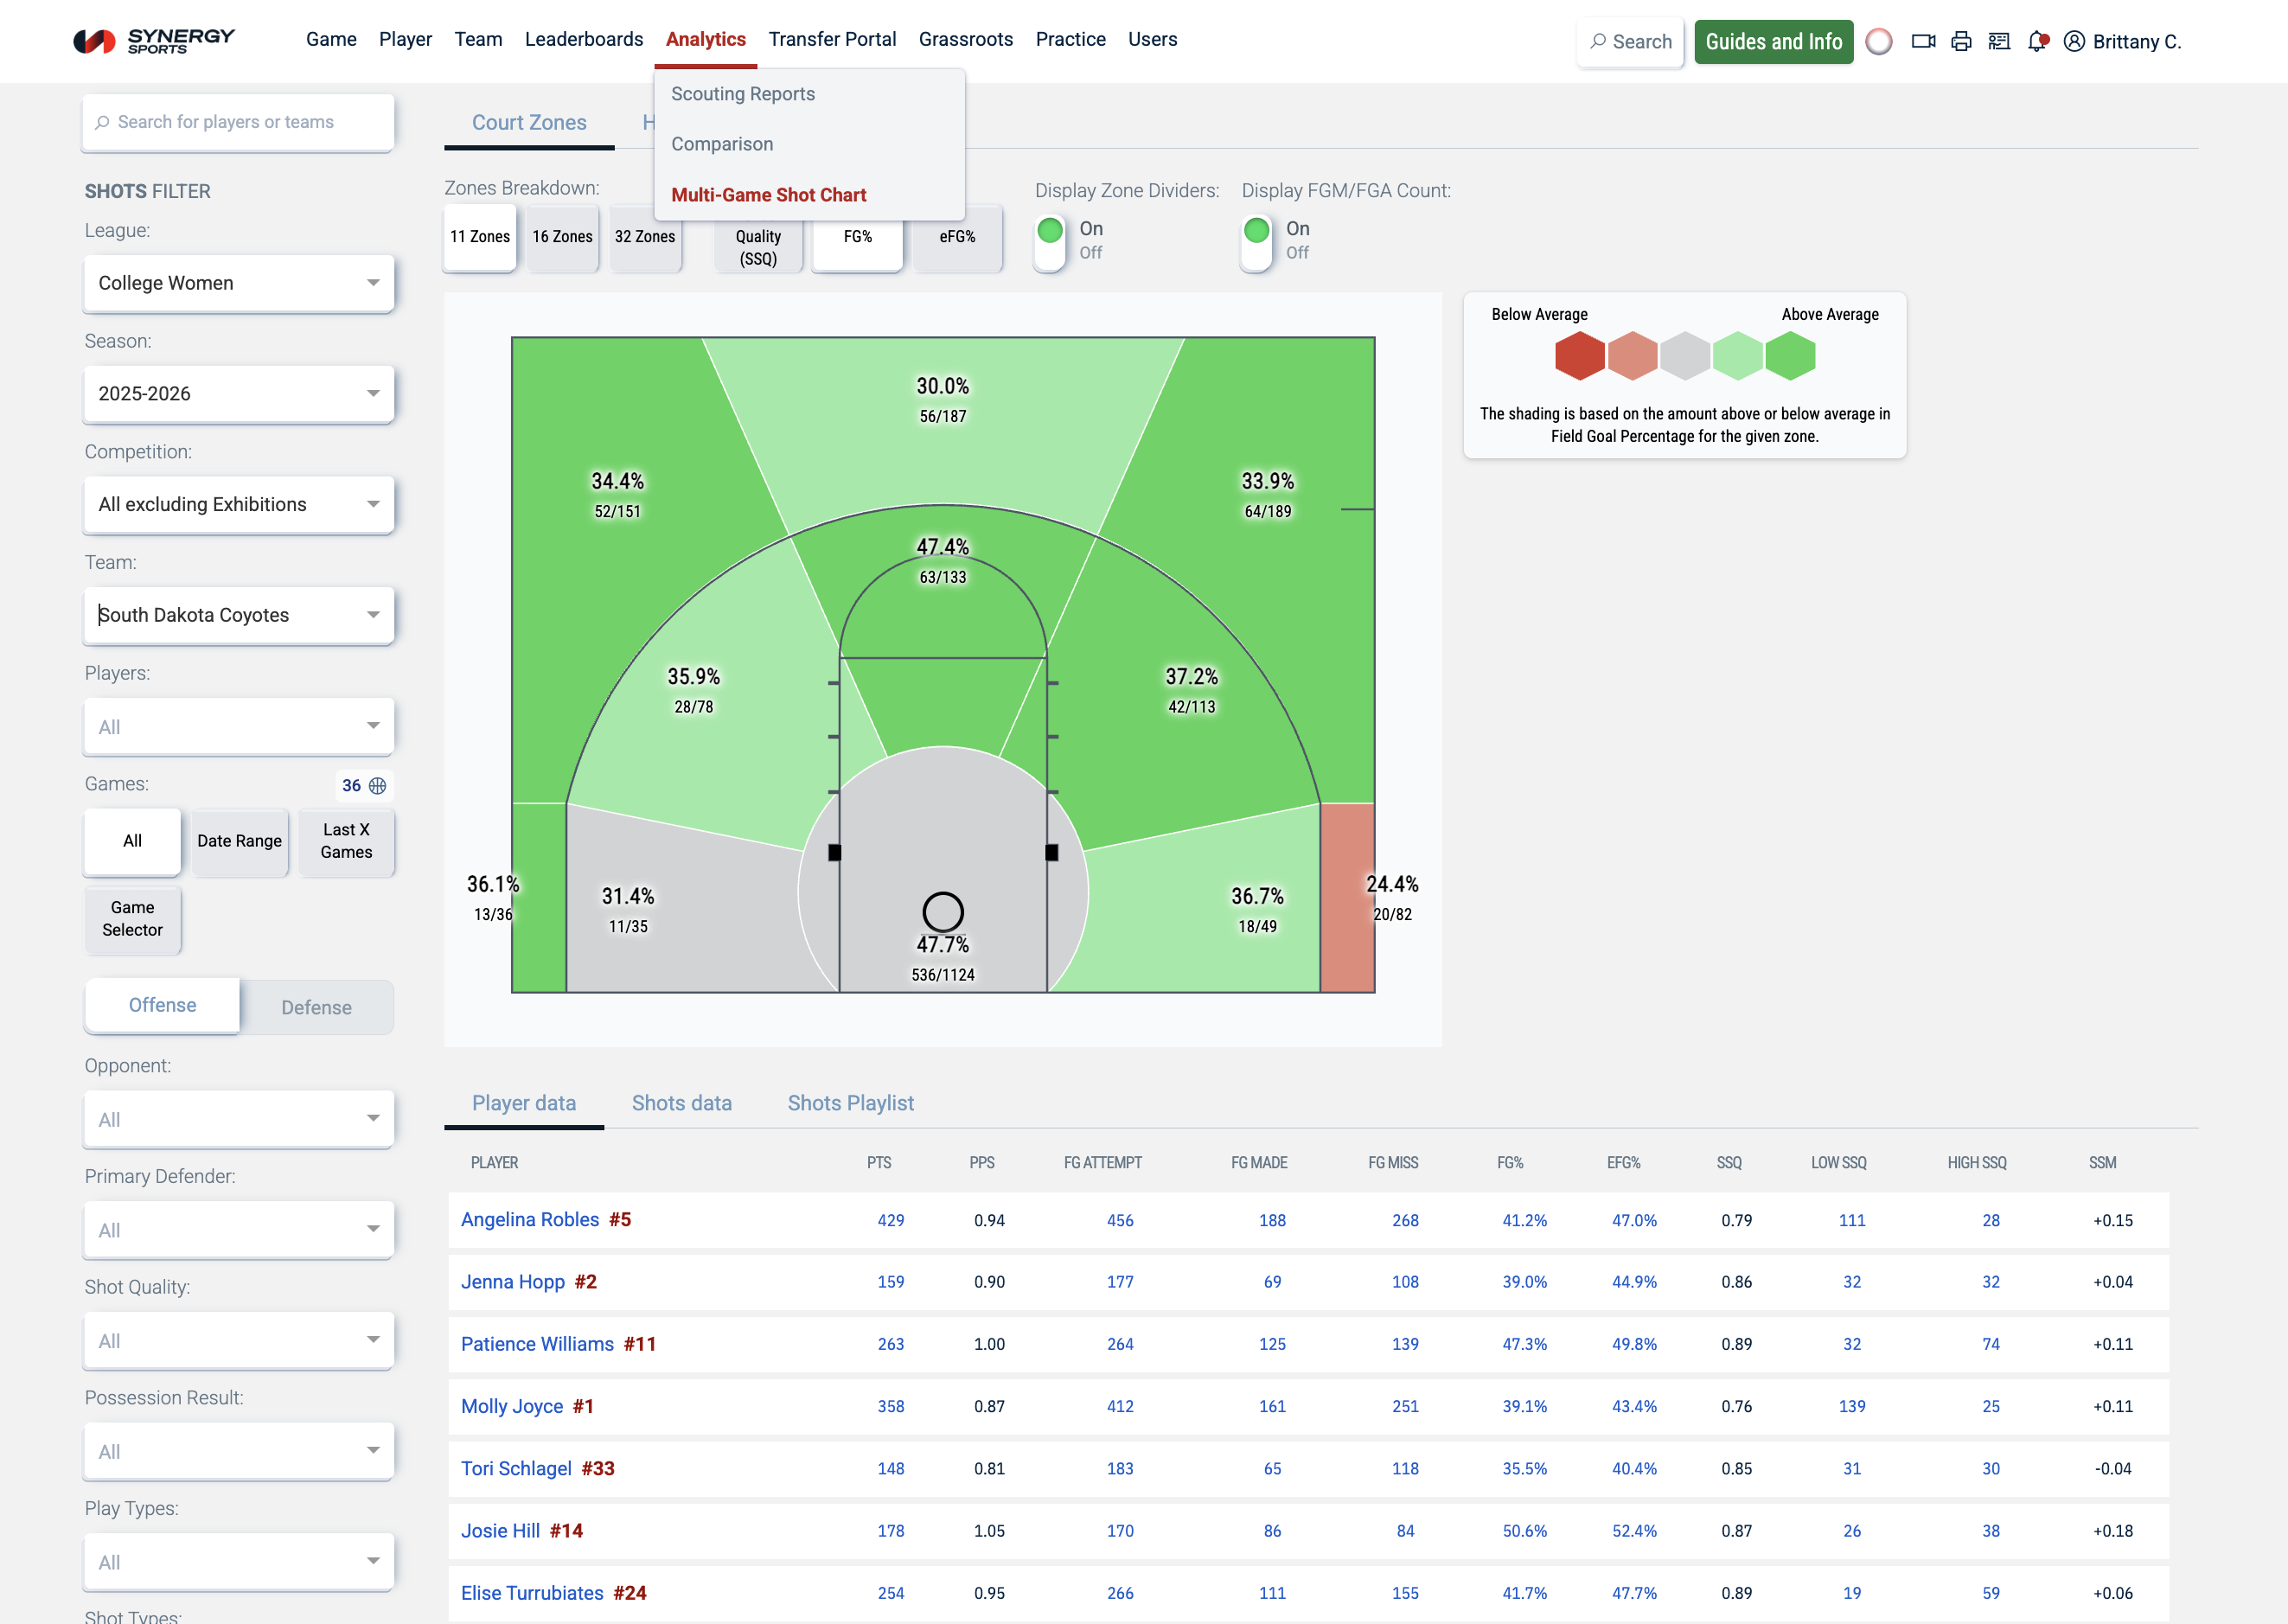
Multi-Game Shot Chart
The Multi-Game Shot Chart (MGSC) allows you to track shots and their respective locations on the floor, over the course of an entire season. Use this tool to select specific parameters for what types of shots you want to see.
**Click here to view the full Multi Game Shot Chart article**
Scouting Report
The Scouting Report grants access to additional comparison tools that provide detailed metrics on opponent tendencies:
- Summaries
- Heat Checks
- Tempos
**Click here to view the full Scouting Report article**
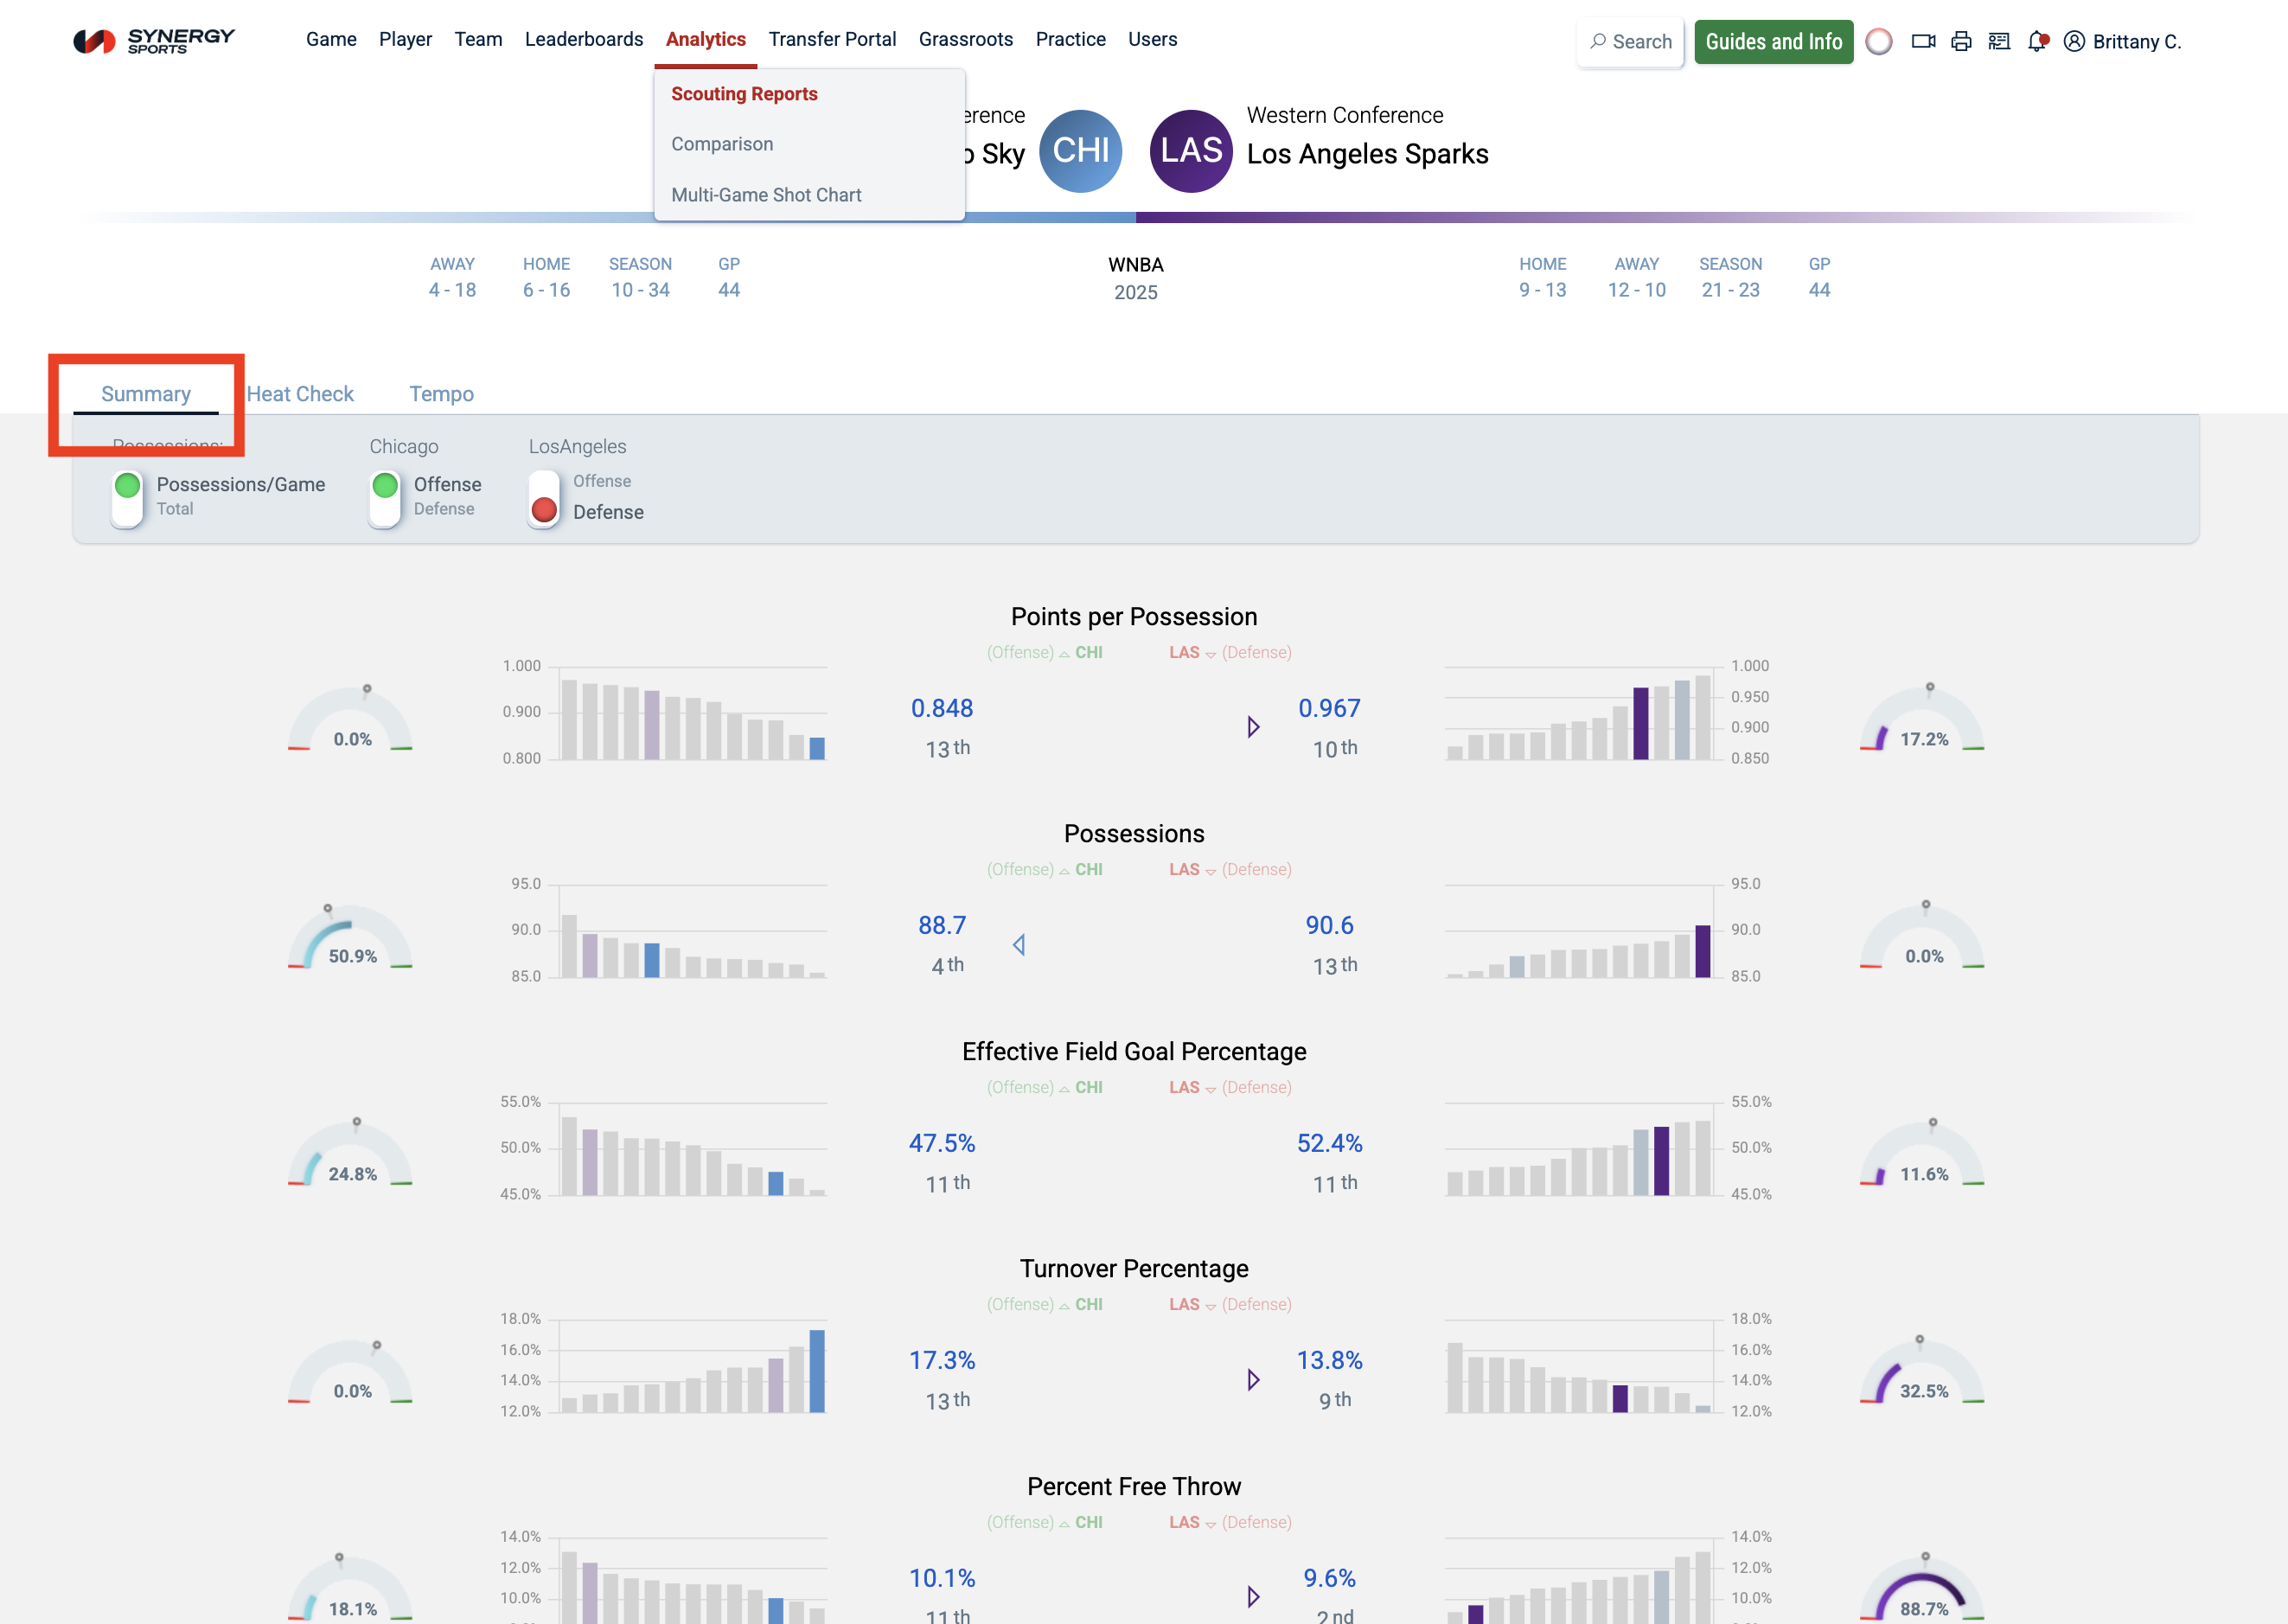
Summaries
Summaries show a recap of statistics for two selected teams, including total games played and their overall home and away records to date. You can also compare a variety of game stats.
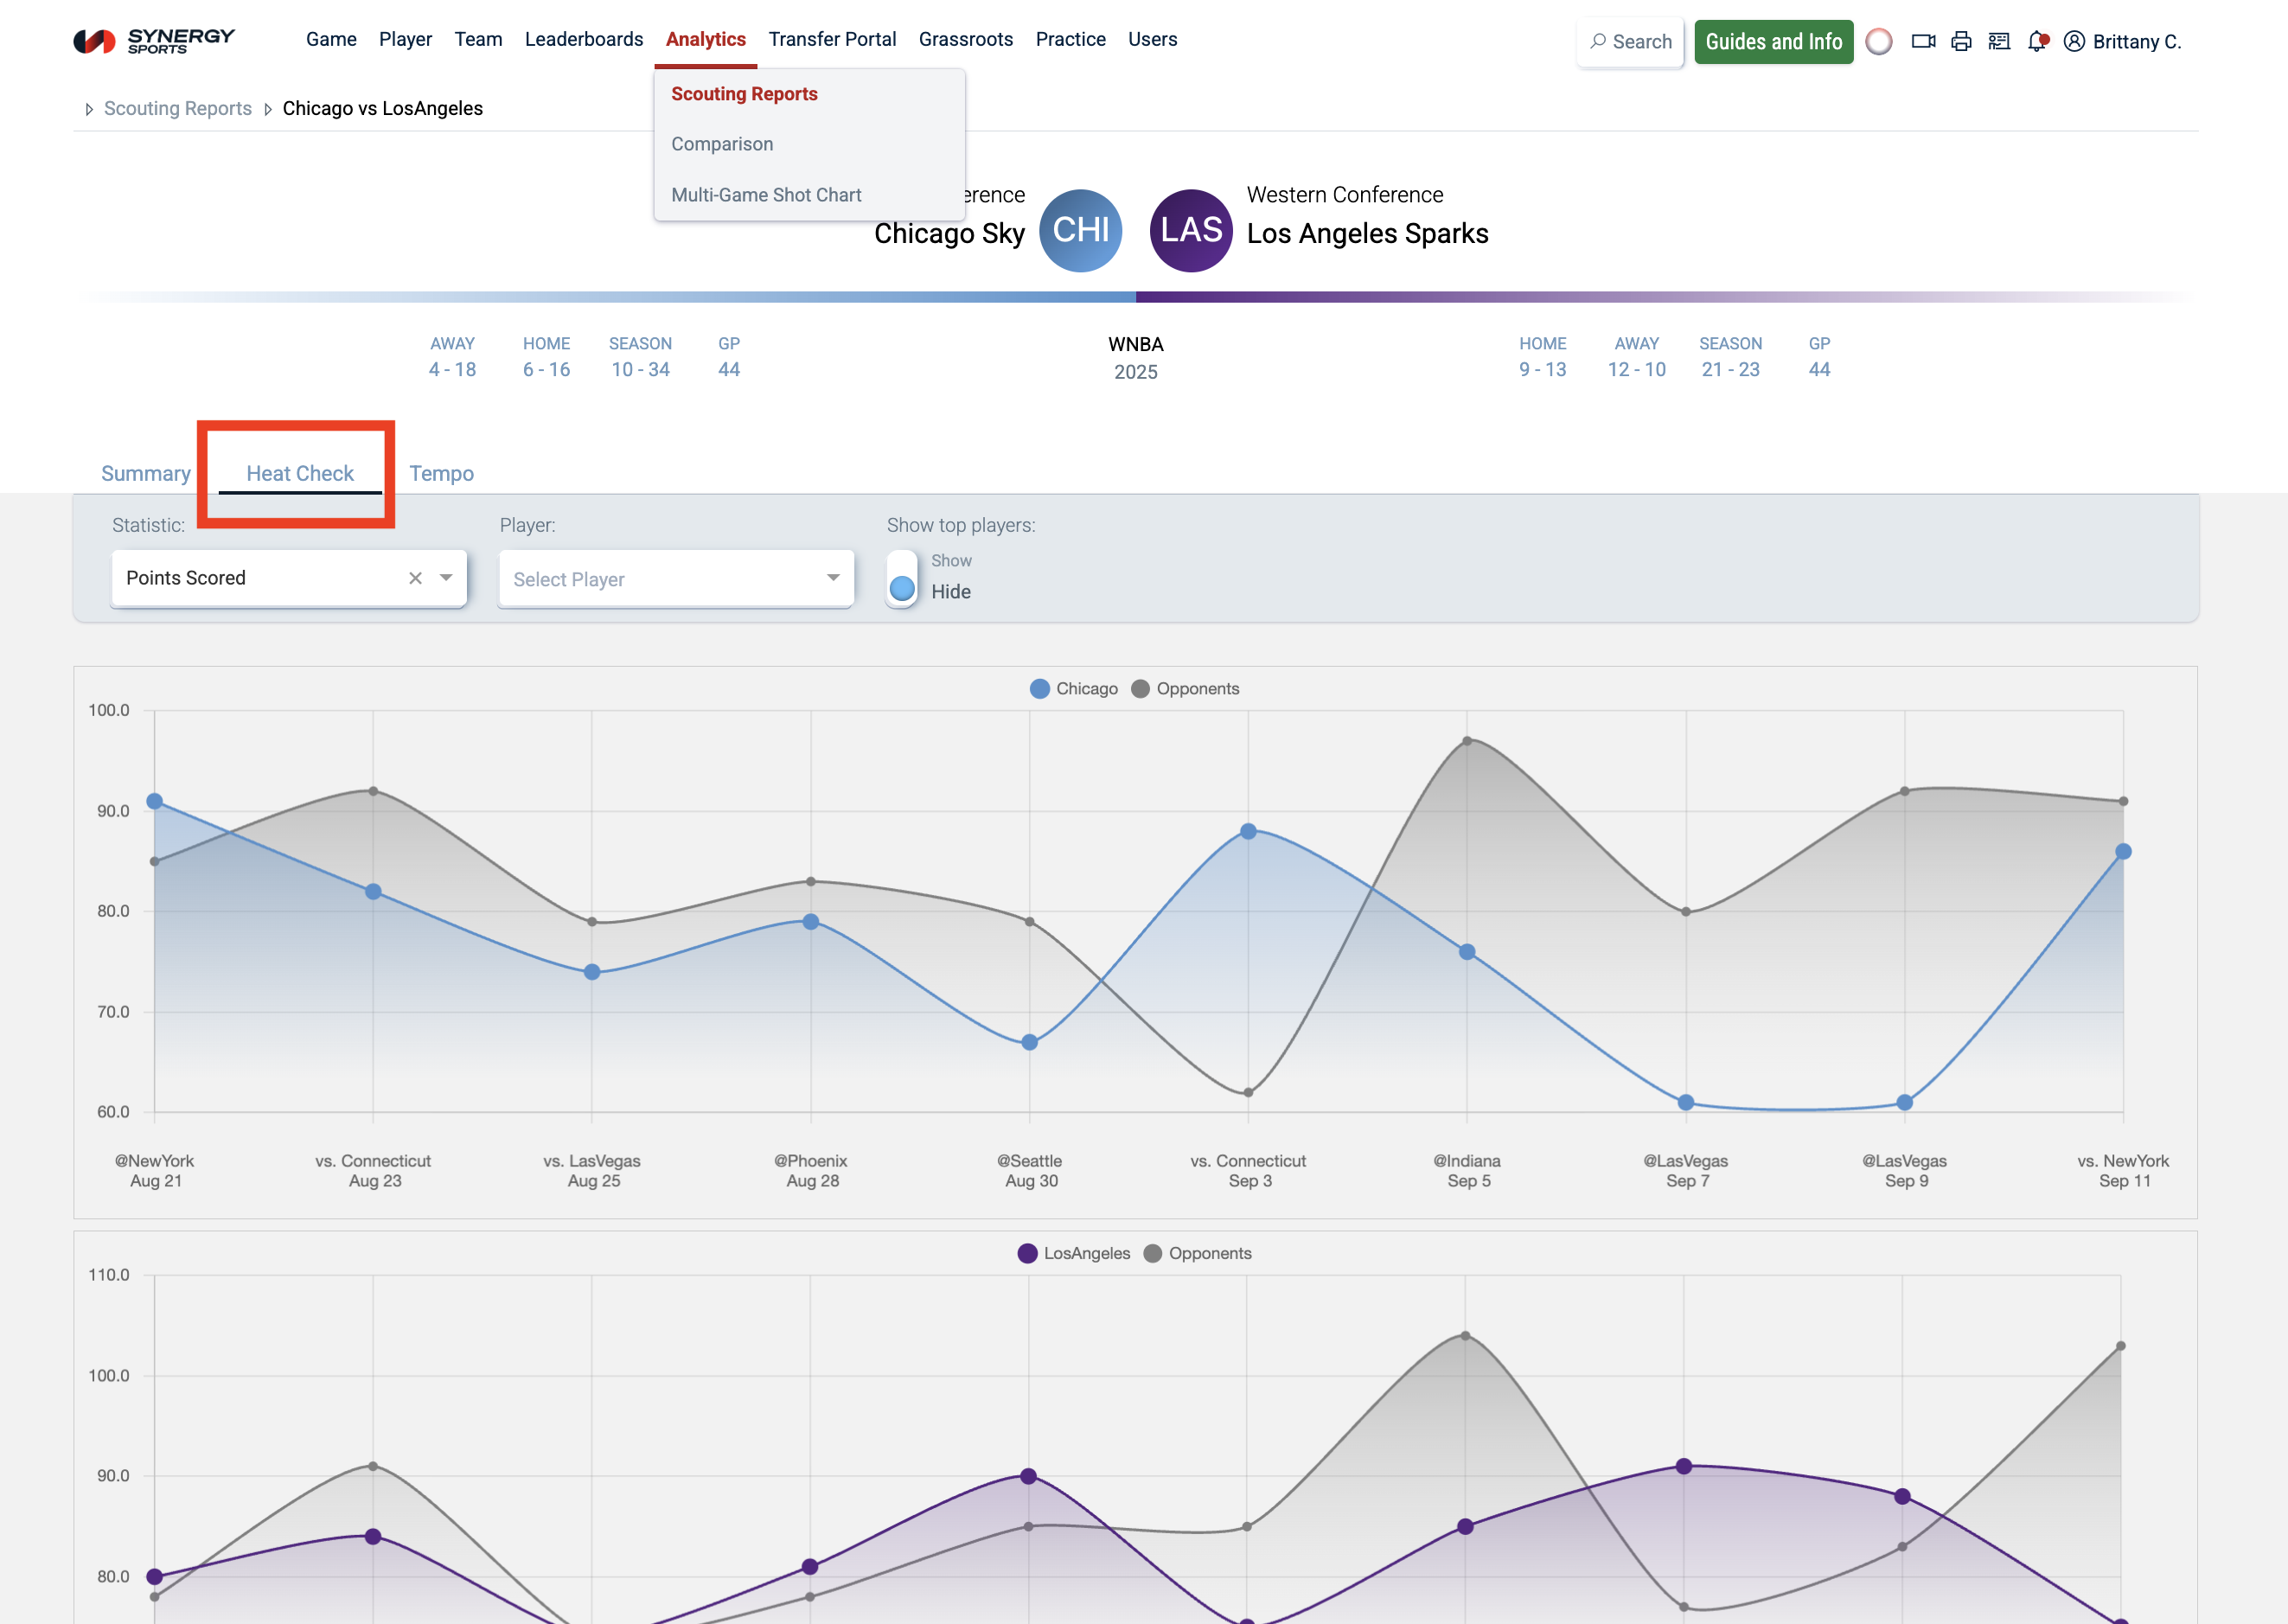
Heat Check
Heat Checks provide you with a visualized graph of the last 10 games for two selected teams. The graph evaluates key players and tempo, based on the number of possessions and effectiveness.
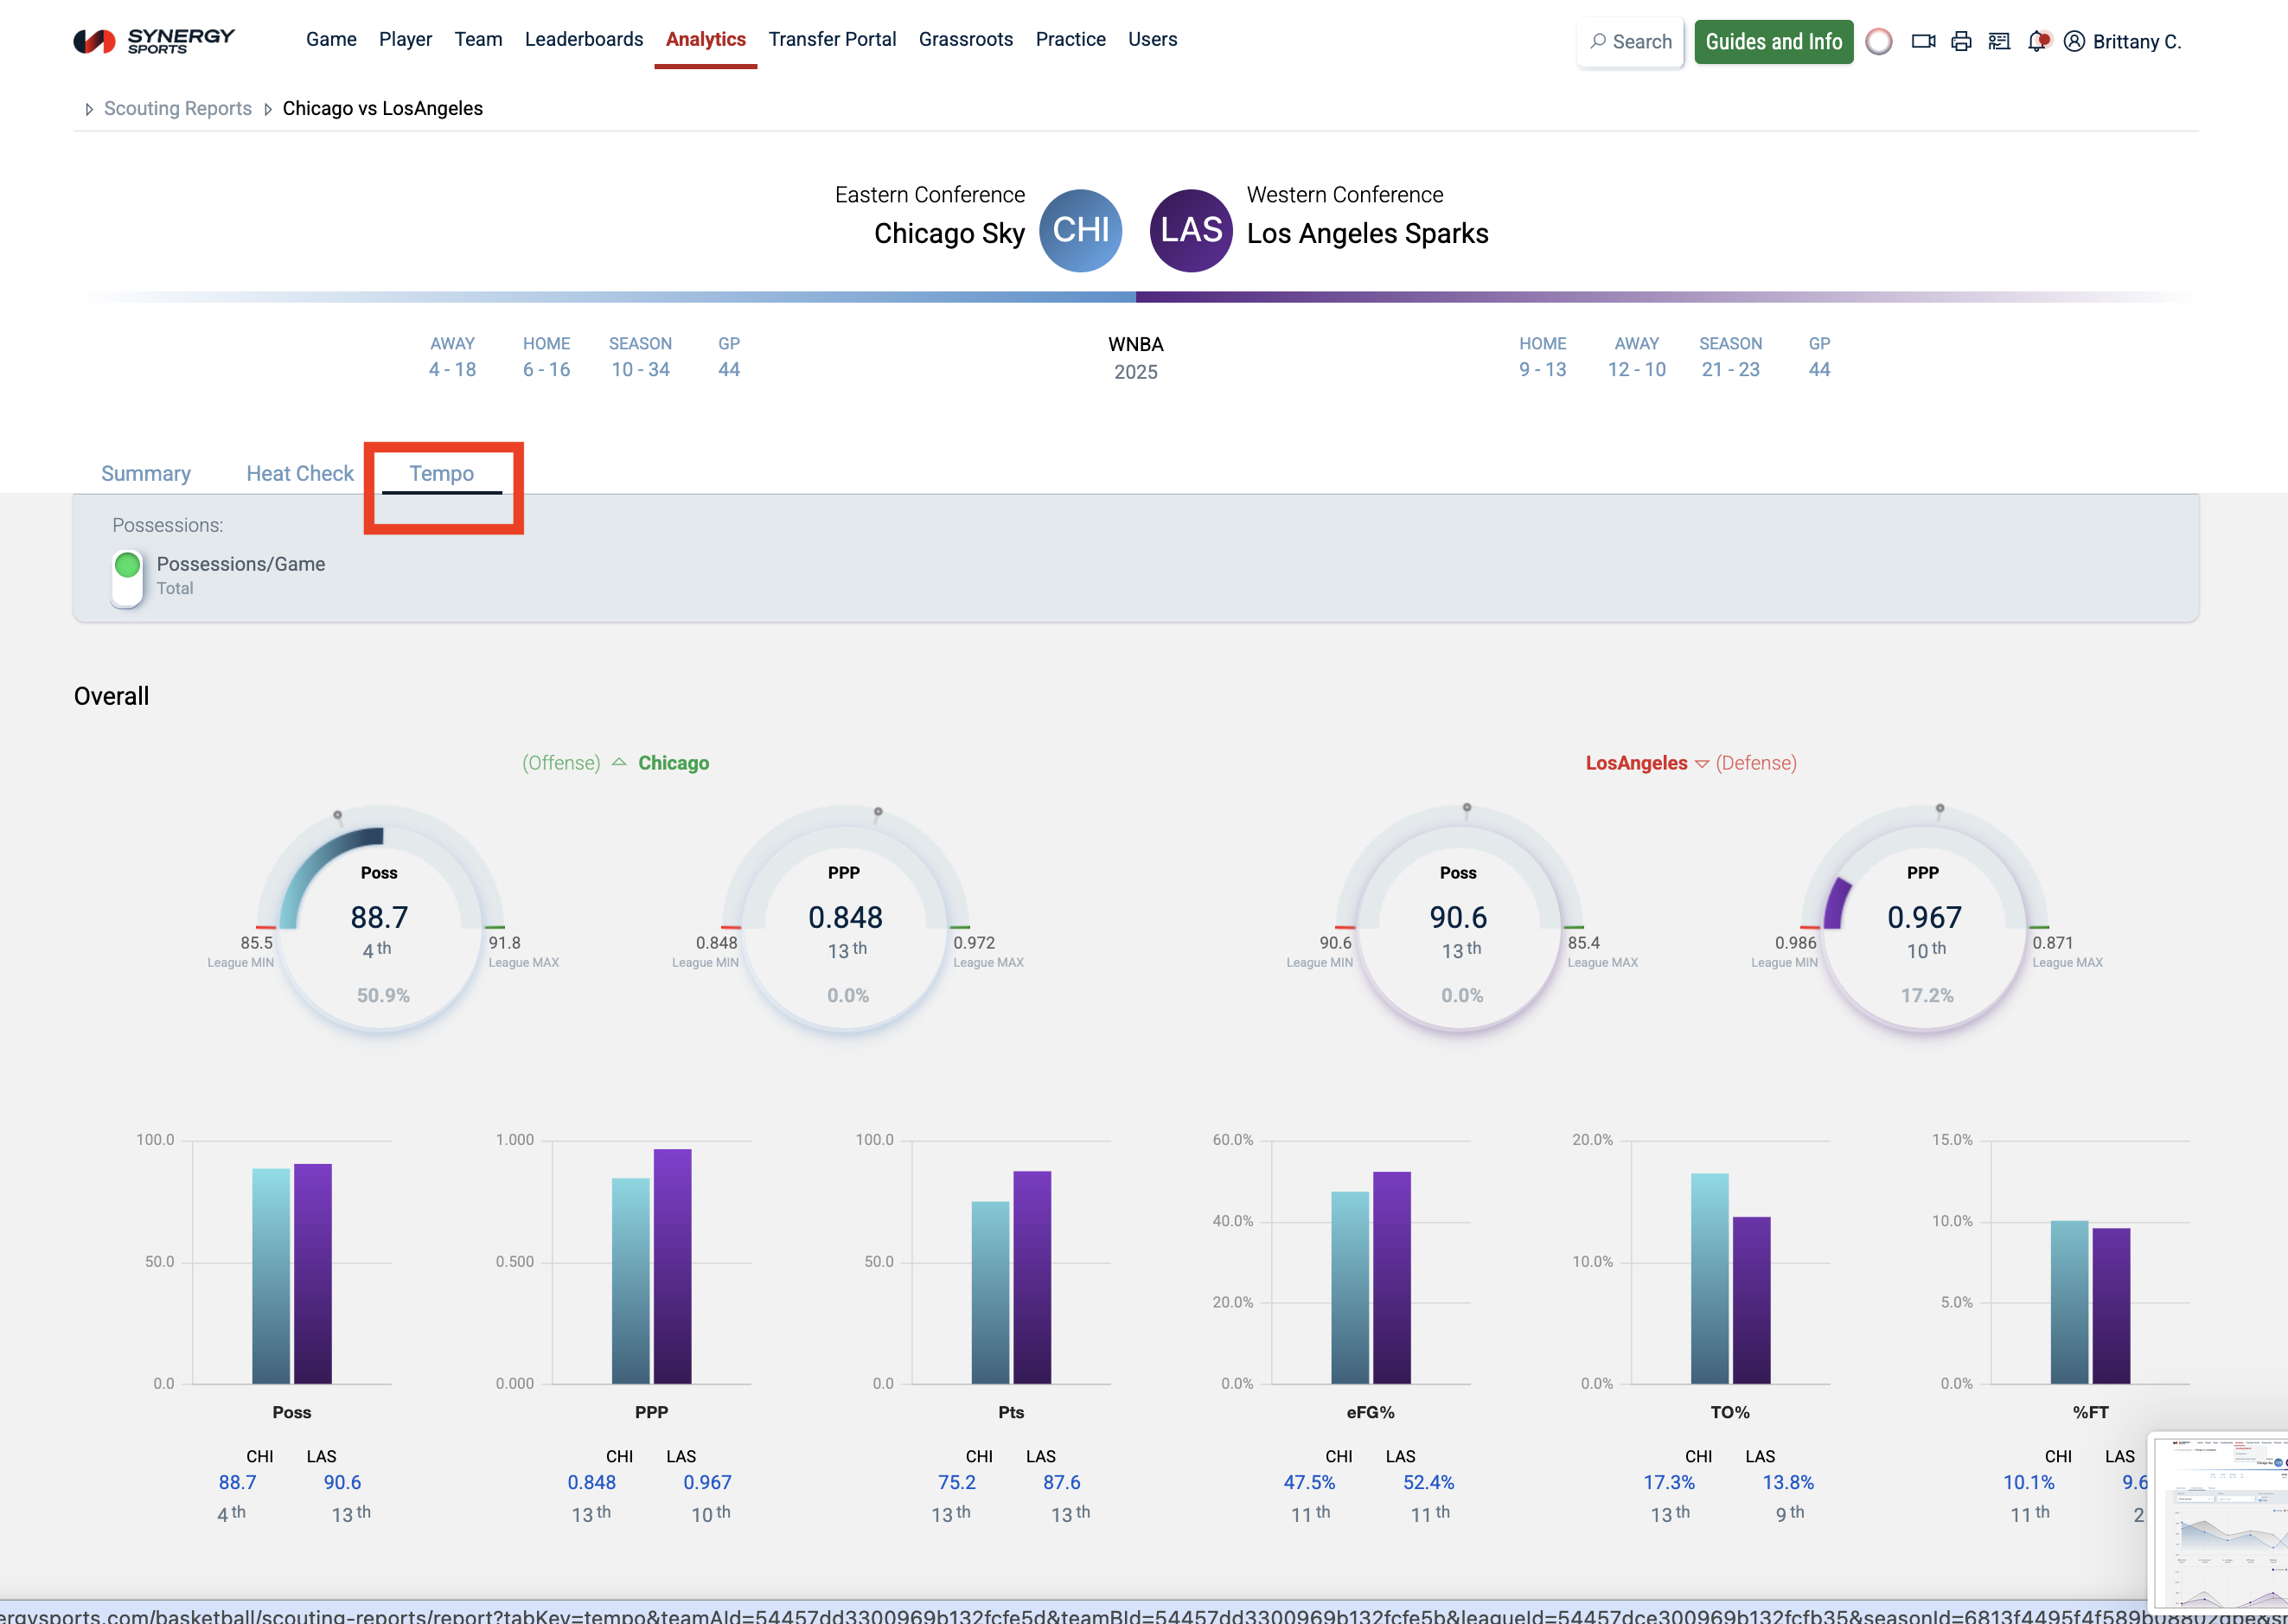
Tempo
The Tempo tab displays the number of possessions per game and the points per possession per game, and where they rank within their league. It will also show this data in the Half Court and Transition situations.
Was this article helpful?
That’s Great!
Thank you for your feedback
Sorry! We couldn't be helpful
Thank you for your feedback
Feedback sent
We appreciate your effort and will try to fix the article